Week 13 Shirley‘s Blog
Lab:
Climate VS Weather
Climate is what we expect, weather is what we got
Jigsaw activity:
Our group read the Iowa Natural Heritage Foundation which is an organizer that works with private landowners and public agencies to protect and restore Iowa's land, water and wildlife.
Big takeaways:
Talked about Iowa is experiencing more extreme weather, including increased rainfall, flooding, and droughts. Also, flooding is Getting Worse: River flow has drastically increased. And Agriculture is Suffering
What they do:
Land, Water & Wildlife Protection,Multi-Use Trails( connect with the nature),Land Stewardship & Management(rebuilt the good wildlife,Conservation Policy(support for protect activities and funds)
Preserving natural habitats like prairies and wetlands can help absorb excess water and store carbon, making Iowa more resilient.
Then we separate in to Letter group, We need to finding data support:


- Climate changes can negatively impact agriculture, increase heat waves, reduce air quality, and increase food-, water-, and animal-borne diseases.
- Adapting planting dates, selecting better crop varieties, and increasing access to irrigation and fertilizers could offset potential declines in crop yields.

- In the chart below, you can see the estimated impact of changing the sowing date and adopting different crop varieties on crop yields at the end of the century under the RCP6.0 scenario that we looked at before.
- A longer growing season could also disrupt the function and structure of a region's ecosystems and could, for example, alter the range and types of animal species in the area.

- This figure shows the length of the growing season in the contiguous 48 states compared with a long-term average. For each year, the line represents the number of days shorter or longer than average. The line was smoothed using an 11-year moving average. Choosing a different long-term average for comparison would not change the shape of the data over time.
Due to climate change, the U.S. growing season has lengthened significantly—now averaging over 10 days longer than the long-term historical norm. In Des Moines, frost-free days have steadily increased since 1970. While this may benefit crop production if farmers adapt with new planting strategies and crop varieties, yielding up to 17% more for some crops like maize, it also results in longer allergy seasons and poses risks to biodiversity. (from my own reading and research)
Then we be separate in last group to do our statement poster
We wrote:
Iowa annual precipitation and temperature has steadily increased in the 20th century leading to negative effects
Data:
- Annual temperature increased by 1 degree (1979-2021)
- Annual precipitation increased by 4.1% (1979-2021)
- More intense+shorter time periods
- Temperature increase speed up corn development negatively impacting amount of corn produced
- High heat negativity effects meat, milk, and egg products
- Also impacts livestock, farmers ( and other outside workers) and trees.

什么是温室气体?
地球大气中的某些气体被称为温室气体。就像温室一样,它们让阳光穿过大气层到达地球表面,然后将其热量困在大气中。最丰富的温室气体有:
- 二氧化碳 (CO 2) - 生物腐烂和火山爆发都会自然释放二氧化碳。然而,人类燃烧化石燃料是造成大气中二氧化碳过量的主要原因。
- 一氧化二氮 (N2O ) -细菌会自然产生一氧化二氮,但人类通过工业活动(如工厂废料和肥料等农产品)产生更多的一氧化二氮。
- 甲烷 (CH 4) - 甲烷自然产生于湿地和海洋,但人类的农业活动也导致甲烷排放量过量;奶牛在消化食物时打嗝,释放出大量的甲烷。
- 水蒸气 (H 2 O) - 受气候变化的影响,地球系统和全球水循环中的能量增加。随着气温升高,更多的水蒸发并以水蒸气(一种吸热分子)的形式进入大气。
- 臭氧 (O3 ) -位于大气高处的臭氧层(自然形成的臭氧)阻挡太阳辐射,有助于调节地球温度。然而,在大气低层,人类活动(例如车辆尾气排放)会产生额外的臭氧。这些臭氧有害,因为它会将热量滞留在大气中,并形成雾霾。
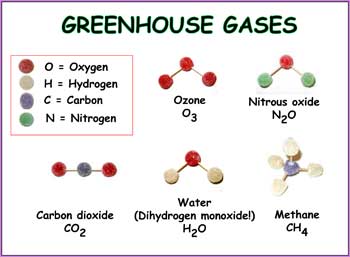
温室气体是由三个或三个以上原子结合在一起构成的复杂分子。气体快速移动并与大气中的其他分子发生碰撞。这导致温室气体分子振动并呈现不对称形状。
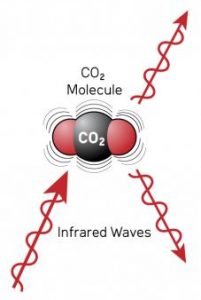
什么是温室效应?
温室效应描述了地球大气中的温室气体如何捕获热量。
当来自太阳的红外辐射到达地球时:
- 一些辐射被大气和高反照率的表面(如冰)反射回太空。
- 其他辐射被温室气体和反照率较低的表面(如陆地和水)吸收。
- 吸收的辐射随后以热量的形式释放出来,从而导致地球温度升高
- 温室效应是地球自然过程的重要组成部分。如果没有太阳辐射的热量和大气层的保护,地球的温度就无法调节以维持生命。然而,当地球系统失去平衡时,温室效应可能会过度发展。
反照率效应
反照率是指表面反射的能量。浅色表面往往具有较高的反照率,因为它们反射的能量更多。深色表面往往具有较低的反照率,因为它们吸收的能量更多。
- 深色材料吸收热量——反照率低
- 较轻的材料反射热量——高反照率
碳循环
碳是一种丰富的元素,对地球生命至关重要。如下图所示,碳在碳循环中自然地在大气、陆地和水体之间流动。地球上的大部分碳储存在岩石和沉积物中,也存在于海洋和大气中。
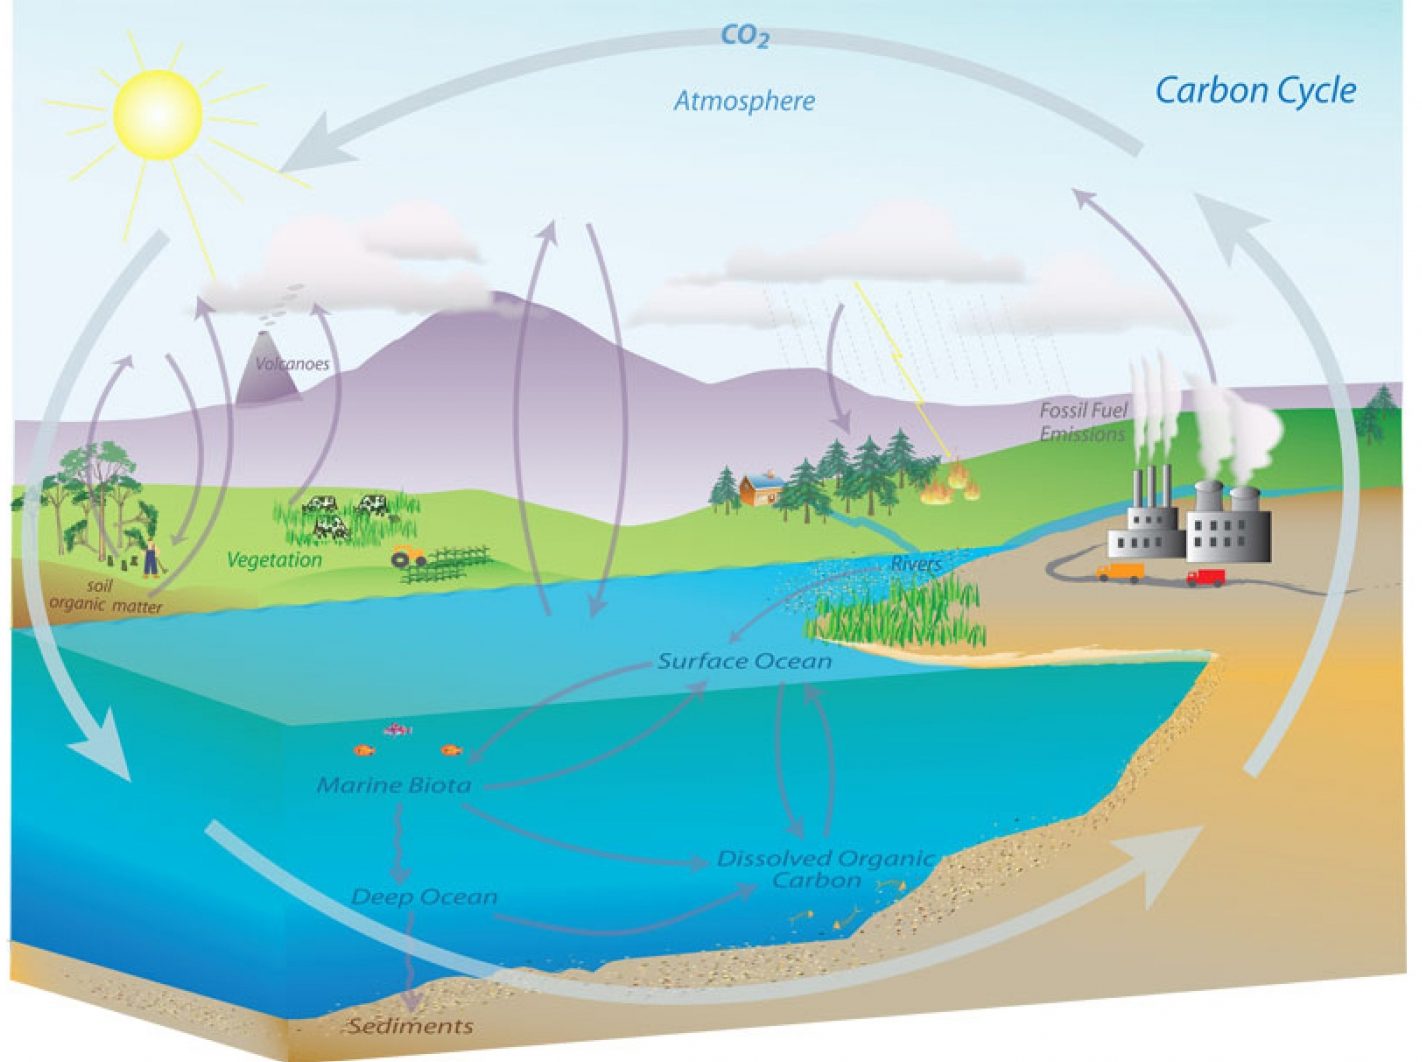
二氧化碳是一种温室气体,对地球上的生命至关重要。
什么是 ppm?
Comments
Post a Comment